Today’s guest entry by Amelia McNamara (University of St. Thomas) describes a creative way that she tackled a problem in one of her upper level courses.
One note: The JSM is underway. Looking for interesting talks? Mine’s excellent Shiny for JSM 2019 app for those of you in Denver.
This past semester, I taught two sections of a course called Advanced Statistical Software (yes, I’m aware of the acronym. We’re changing the course title soon…). The course was focused on R: we spent the first half of the semester going through R for Data Science and learning about doing data science in R, and the second half reading selections from Advanced R, and learning about R as a language. It was the most computationally-focused class I’ve ever been able to teach, which was fantastic.
On top of R, I also taught students how to use git and GitHub, and all student work was submitted through private repositories. At the beginning of the semester, 63% of my students said they had never used git before (even though the majority of students were upper-level CS majors), and by the end of the semester everyone could commit, push, pull, manage merge conflicts, and more. I’m so proud of them!
Private repositories for student work
If you are going to use GitHub in a class, you likely need to generate a number of private repositories for your students to use. This is to avoid violating FERPA law, as well as general ethics of not forcing students to put work on the internet that they might not want to share publicly. There are two ways to generate many private repos for class use:
- Follow Mine Cetinkaya-Rundel and Colin Rundel’s advice, and generate private repositories on GitHub using the GitHub API, particularly through the ghclass package the Cetinkaya-Rundels have developed.
- Use GitHub Classroom to generate private repositories through their web interface. For more on this approach, see Jo Hardin’s recent post.
Whichever approach you choose, you’ll want to verify yourself as an instructor with GitHub to get additional benefits, including unlimited private repositories (crucial!) and a swag bag for your classroom.
Aside on GitHub swag
I chose to use GitHub Classroom, and I asked for a swag bag in advance of my class, so I had lots of goodies for my students. The bag I received came with the following:
- copies of the git cheatsheet for all my students. (five stars, very useful in case things fail with usethis and we have to go to the terminal to re-sync RStudio and git)
- copies of the git flow cheatsheet (pretty useless, I wish they’d stop sending)
- copies of the GitHub flavored markdown cheatsheet (slightly useful at the beginning of the semester)
- copies of the GitHub for robotics comic book (fun, students seem to like)
- some number of GitHub posters (awful, I wish they would stop sending)
- enough GitHub stickers for all my students to have some choice about which one they want (students who do a particularly good job on an early assignment get first pick, everyone gets a sticker)
- two redemption codes good for GitHub t-shirts
Of course, with only two t-shirts and more than 50 students, I had to find a way to distribute the shirts. I decided on a whim that I would give them to the student in each section who had the most commits on GitHub over the course of the semester.
I made this promise to students filled with data hubris, and without verifying it was possible to calculate this. It turns out, calculating the number of commits someone has made over a semester is a little tricky.
Counting commits
GitHub has a nice API. If you want to access this API through R, you can use the gh package. However, when I looked into this, it became clear that the API would make it challenging to compute commits per student. The API allows you to find commits on a repository but not commits from a particular user. So, if I’d gone down this road I’d have needed to generate a list of repos for each user, and then hit the API with requests for the number of commits on each of those repos. I think this is possible (I’d love to see code solutions if you have them!) but I went a different direction.
Instead, I realized that if I went a user’s profile website, it said the number of commits they had made directly on the webpage:
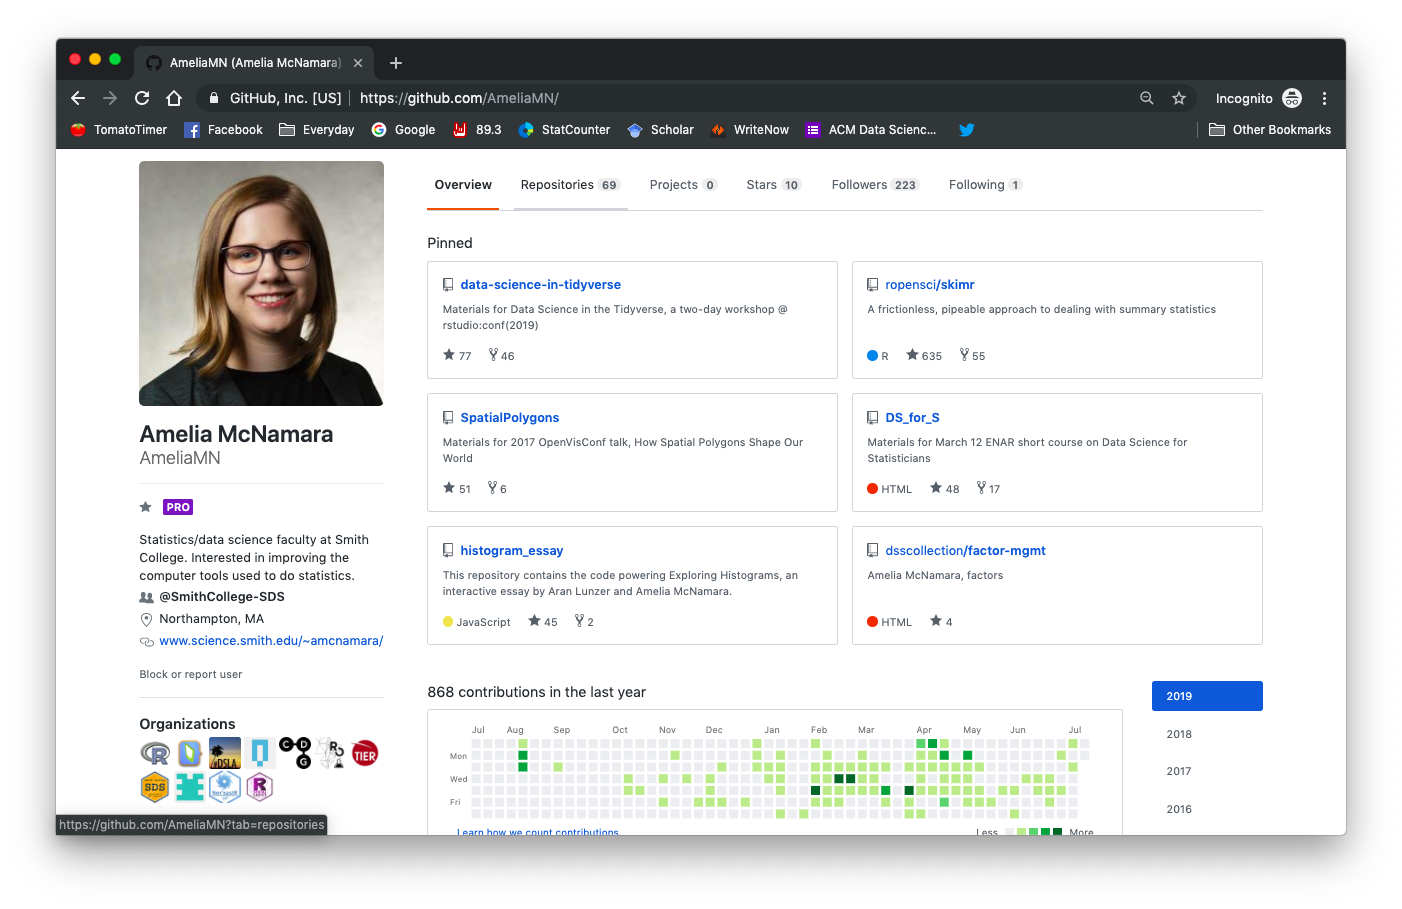
I realized I could scrape that number from the HTML of each of my students’ profile pages. With GitHub classroom, you can download a roster for your class and get a list of their GitHub usernames, which can be easily converted into URLs. Here is some code to accomplish this. (As a note on style, instead of starting this blogpost with a list of packages, like we typically do in RMarkdown documents, I’ve inserted library() calls into the chunk where that package is first used.)
library(readxl)

roster <- read_excel("~/Downloads/classroom_roster.xls")

roster <- roster %>%
  mutate(url = paste0("https://github.com/", github_username)) %>%
  filter(!is.na(group_name))
For the purposes of this blog post, I’m not going to use my students’ data (remember, FERPA!). So, let’s make a little fake dataset.
library(dplyr)

roster <- tibble(url = c("https://github.com/AmeliaMN", "https://github.com/hglanz", "https://github.com/hardin47", "https://github.com/nicholasjhorton"))
Now that I have some GitHub URLs, I can use the rvest package to scrape the HTML pages. We’ll start with an HTML session,
library(rvest)

session <- html_session("https://github.com")
This step may seem unnecessary now, but we’ll come back to why a session is needed for this to work in my real problem, rather than this toy data.
Once we’ve simulated a session in an HTML browser, we can write a function to compute the number of commits for a user. This code starts with a session, jumps to a GitHub URL, and reads the HTML. Then, it grabs a particular HTML node (I used Chrome Developer Tools to help me figure out that I was interested in h2.f4.text-normal.mb-2), extracts the text from that node, strips the whitespace from the number, plucks it out, and parses it as a number (in case the number of commits goes into the thousands, when the string gets formatted with a comma on GitHub).
library(readr)

commits <- function(url, session) {
  session %>%
    jump_to(url) %>%
    read_html() %>%
    html_nodes("h2.f4.text-normal.mb-2") %>%
    html_text() %>%
    gsub("^\\s+|\\s+$", "", .) %>%
    pluck(2) %>%
    parse_number()
}
Of course, we could write a for() loop to iterate through the vector of URLs and find those numbers. In fact, that’s what I did while I was hacking my way through this problem at the end of the semester, with my students sending me “hey, who won those t-shirt??” messages on Slack.
But, I knew that the more efficient and elegant way to do this was through the use of purrr. When I attempted to refactor my own code for this blog post, I ran into trouble. Luckily, the gracious Charlotte Wickham came to my rescue!
library(purrr)

roster <- roster %>%
  mutate(commits = map_dbl(url, commits, session = session))
Here is the crucial detail– that map_dbl() needs to be inside a mutate() command. That’s because it returns “an atomic vector of the indicated type” (in this case, double). To add it to my dataframe, I needed to mutate(). Once we have that done, we can see who made the most commits:
roster %>%
  arrange(desc(commits))
## # A tibble: 4 x 2
## url commits
## <chr> <dbl>
## 1 https://github.com/nicholasjhorton 1936
## 2 https://github.com/hardin47 431
## 3 https://github.com/AmeliaMN 411
## 4 https://github.com/hglanz 77If we were giving away t-shirts based on this, Nick Horton would win!
I did this same process with my students’ data, and came up with the winners for each class. But, when looking at my data, I realized that counting the number of commits over the entire year wasn’t what I promised students. I actually said I would pick winners based on the commits during the semester. This required me to get creative. I realized that those little green boxes that show your GitHub activity actually have data associated with them. So instead of just grabbing the singular number, I could scrape the green boxes. Here is a function that finds those boxes and selects the data associated with them.
commits_by_date <- function(url, session) {
  session %>%
    jump_to(url) %>%
    read_html() %>%
    html_nodes("rect.day") %>%
    html_attrs() %>%
    map_dfr(as.list) %>%
    select(count = `data-count`, date = `data-date`) %>%
    mutate(
      date = parse_date(date),
      count = parse_number(count),
    )
}
Once again, this code has been generously refactored by Charlotte (who said something to the effect of “it was fun!” just proving what nerds we all really are). My hacky solution had mutate() commands creating dummy variables to allow me to spread() something that didn’t really make sense. Charlotte was able to insert some more purrr goodness into the function, with that map_dfr(as.list).
Now that we have a function to get the data from HTML pages, we can figure out who made the most commits. In my hacky, non-purrr solution, I’d had to do the date filtering inside my for() loop, because I didn’t have a good way to store all the dates for all the students in a good way, and thus needed to do all the computation on a per-student basis. Again, the refactor has made it more elegant.
library(tidyr)
roster %>%
  mutate(by_date = map(url, commits_by_date, session = session)) %>%
  unnest() %>%
  filter(date > as.Date("2019-02-04"), date < as.Date("2019-05-24")) %>%
  group_by(url) %>%
  summarise(total = sum(count)) %>%
  arrange(desc(total))
## Warning: `cols` is now required when using unnest().
## Please use `cols = c(by_date)`## # A tibble: 0 x 2
## # ... with 2 variables: url <chr>, total <dbl>If we go by this method, I would win the t-shirt! (I swear, I didn’t doctor this example just to hypothetically win a GitHub t-shirt.)
Authenticating on GitHub
There is actually one more wrinkle– almost all my students’ commits were in private repos in our GitHub Classroom. This means that looking at their profile pages without being logged in doesn’t work. If you ran the above code on my roster, you’d get many students with 0 commits. Again, this wasn’t fair to what I promised my students. To use this code to count commits in private repos (that I have access to), I needed to create a more complex html_session(). If you were authenticating with a site other than GitHub, this code would need to be different, but luckily for me I found Garrett Grolemund’s example with GitHub logins so I didn’t have to generate the code myself.
I don’t want to put my GitHub password into this blog post, so I can’t show you the output of this code, and you’re just going to have to take my word for it that this rvest code will also see private GitHub Classroom contributions.
session <- html_session("https://github.com/login")

login <- session %>%
  html_node("form") %>%
  html_form() %>%
  set_values(login = "YourGitHubUsername", password = "SuperSecureP@ssw0rd")


github <- session %>%
  submit_form(login, submit = "commit") %>%
  read_html()
So what?
My primary reason for writing this up was to help anyone else who might be searching the web to figure out how to fairly distribute their GitHub swag bag t-shirts.
But, I can see the nugget of a lesson that could be applied to a future version of my Statistical Software class. Charlotte and I engaged in a sort of code review process. I had written something that worked, but was ugly and inelegant. But, because we both “speak” R, she was able to read and understand my work and consider how to rephrase it. Seeing the refactored code helped me learn more about purrr, because I was steeped in the context of the data.
I think I could have come to the right solution for the first function and application of map() with a little more work on my own, but the second function and its elegant use of map_dfr(as.list) is something that I could feel on the edge of my consciousness, but I don’t think I would have made it to on my own.
Could we give this experience to students in data science classes? Nick recently wrote a post about refactoring, which I think could be done by a student on their own work, or by another student in a peer code review. To me, it might be more useful in the code review format, but I’m not sure how it would be structured. Code review does seem to work better when the person reviewing the code is at least slightly more advanced than the person who wrote it. In this case, although I would consider Charlotte and myself to be peers, she’s clearly the purrr master.
Of course, we can’t somehow rank our students and have them review the code for the person right below them in ability– there’s no objective way to assess “ability” in this way, and what happens to the person at the bottom of the ranking? Would they review the code of the person at the top? A better idea would probably be to pair students of similar ability levels, or simply to randomly assign pairings.
I also suspect if students were doing peer code review on an assignment where everyone was trying to accomplish the same thing (e.g., generate a number of bootstrap samples), it would be hard for them to escape the easy cognitive route of refactoring their peer’s code to be closer to their own original approach. So, it might be better to have them review code from an assignment where each created something reasonably different (e.g., create a data visualization of your choice from data in the fivethirtyeight package). However, this activity of doing code review on a problem you’re not familiar with (as Charlotte did for me) is a more challenging task.
I do think reviewing code on a problem with which you aren’t intimately familiar is a worthwhile skill to learn. It makes me think of Felienne’s keynote at rstudio::conf 2019, where she argued for teaching programming like we teach other literacies, emphasizing reading code as well as writing it. After hearing her talk, I immediately bumped up the amount of code read-aloud I do in my teaching. But most of the code my students read has been written by professionals, or by themselves. I’d love to give them the experience of reading code by their peers! I think I would assess this much like we assess peer review in writing courses, by giving credit for participating rather than grading the actual output.
What do you think? Have you used peer code review in one of your courses? How did you group students? How did you assess their work?
Bio
This is a guest post by friend of the blog Amelia McNamara. Amelia holds a BA in English and mathematics from Macalester College, and a PhD in statistics from UCLA. She is an assistant professor in the department of Computer & Information Sciences at the University of St Thomas, where she teaches statistics courses. She is active on twitter and (of course) on GitHub. Her website is amelia.mn.
Learn more
- Code review
- Felienne’s keynote
- Garrett Grolemund’s example with GitHub logins
- Advanced Statistical Software course
- ghclass
- GitHub for teachers
About this blog
Each day during the summer of 2019 we intend to add a new entry to this blog on a given topic of interest to educators teaching data science and statistics courses. Each entry is intended to provide a short overview of why it is interesting and how it can be applied to teaching. We anticipate that these introductory pieces can be digested daily in 20 or 30 minute chunks that will leave you in a position to decide whether to explore more or integrate the material into your own classes. By following along for the summer, we hope that you will develop a clearer sense for the fast moving landscape of data science. Sign up for emails at https://groups.google.com/forum/#!forum/teach-data-science (you must be logged into Google to sign up).
We always welcome comments on entries and suggestions for new ones. However, comments on the blog should be constructive, encouraging, and supportive. We reserve the right to delete comments that violate these guidelines.