Leaflet for mapping
Maps are an important way of displaying data.
The leaflet package in R provides access to the Leaflet Javascript libraries (http://leafletjs.com), an open-source mechanism to create interactive maps. The leaflet package (https://rstudio.github.io/leaflet/) provides an interface within R that allows for composing maps using map tiles (e.g., from OpenStreetMap, https://www.openstreetmap.org/#map=5/38.007/-95.844) that can be annotated with markers, lines, popups.
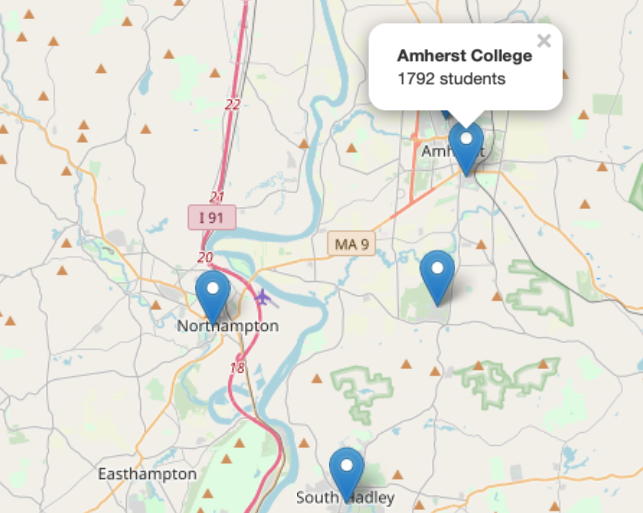
Here’s a simple example where data from higher education institutions from within the Five College Consortium in Western Massachusetts is mapped.
There are four steps:
- Create the dataset that will be displayed
- Create a map widget (according to Wikipedia, a component of an interface that enables a user to perform a function): here we call this
m - Add layers and tiles
- Print the map widget to see the results
# step 1: create the dataset
institution <- c("Amherst College", "Hampshire College", "Mount Holyoke College",
                 "Smith College", "University of Massachusetts")
lat <- c(42.3709, 42.325079, 42.255586, 42.318119, 42.3912)
lng <- c(-72.5170, -72.530837, -72.574503, -72.638139, -72.5267)
students <- c(1792, 1175, 2255, 2600, 28635)
label <- paste0("<b>", institution, "</b><br>", students, " students", sep="")
ds <- dplyr::tibble(institution, lat, lng, students, label)
dplyr::glimpse(ds)
## Rows: 5
## Columns: 5
## $ institution <chr> "Amherst College", "Hampshire College", "Mount Holyoke ...
## $ lat         <dbl> 42.37090, 42.32508, 42.25559, 42.31812, 42.39120
## $ lng         <dbl> -72.51700, -72.53084, -72.57450, -72.63814, -72.52670
## $ students    <dbl> 1792, 1175, 2255, 2600, 28635
## $ label       <chr> "<b>Amherst College</b><br>1792 students", "<b>Hampshir...
Here we have used simple html markup to create a two line label, with institution bolded, that will be displayed.
# steps 2-3: generate leaflet map
library(leaflet)
m <- leaflet(ds) %>%
  addTiles() %>%
  addMarkers(~lng, ~lat, popup = ~ label)
m # step 4: display the resultslabel variable. Here’s an example of what happens if Amherst College is clicked:
Notes
MORE INFORMATION: The RStudio leaflet webpage (https://rstudio.github.io/leaflet/) has more details about the following topics: The Map Widget, Basemaps, Markers, Popups and Labels, Lines and Shapes, GeoJSON and TopoJSON, Raster Images, Shiny Integration, Colors, Legends, Show/Hide Layers, Choropleths, Projections, and Additional Features.
HTML OUTPUT: Because of the interactive nature of the underlying JavaScript library, leaflet maps created within an R Markdown file can’t be rendered to pdf or Microsoft Word. If you try, you will see the following error message:
Error: Functions that produce HTML output found in document targeting latex output. Please change the output type of this document to HTML. Alternatively, you can allow HTML output in non-HTML formats by adding this option to the YAML front-matter of your rmarkdown file:
always_allow_html: yes
Note however that the HTML output will not be visible in non-HTML formats.
Learn more
About this blog
Each day during the summer of 2019 we intend to add a new entry to this blog on a given topic of interest to educators teaching data science and statistics courses. Each entry is intended to provide a short overview of why it is interesting and how it can be applied to teaching. We anticipate that these introductory pieces can be digested daily in 20 or 30 minute chunks that will leave you in a position to decide whether to explore more or integrate the material into your own classes. By following along for the summer, we hope that you will develop a clearer sense for the fast moving landscape of data science. Sign up for emails at https://groups.google.com/forum/#!forum/teach-data-science (you must be logged into Google to sign up).
We always welcome comments on entries and suggestions for new ones.