Today’s guest entry by Kelly McConville (Reed College) describes the creation of data packages in R by instructors and students.
Nuts and Bolts
Nick and I recently taught a workshop and I wanted to use data collected as part of the Urban Forestry Tree Inventory Project. Urban Forestry collected data on the trees in over 200 Portland, OR parks. While these data are fairly clean, they still need a bit of data wrangling that I didn’t want the workshop participants to have to do at that point in time. Therefore I decided to create a data package called pdxTrees. Let’s walk through the steps I took to create the package.
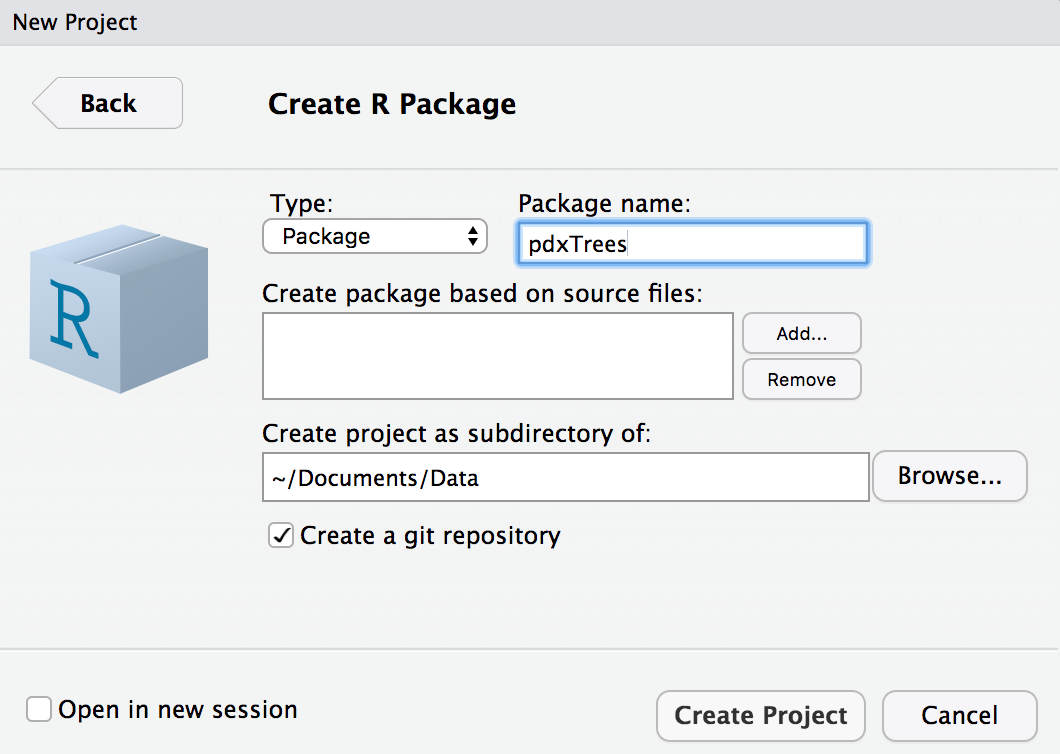
Step 1: Create a version control R package in RStudio by checking the box “Create a git repository.”
Step 2: Use Jenny Bryan’s https://happygitwithr.com/ to create a public GitHub repository and to link it to the new package R Project.
Step 3: Add the raw data and transform it into the clean form I want to share in the package.
- I ran the function
usethis::use_data_raw()to create adata-rawfolder in the R project and the fileDATASET.R.
- I put the raw data files in the
data-rawfolder. - I used the file
DATASET.Rto load and wrangle the raw data. - At the bottom of the wrangling file, I included the following code to create a clean
.Rdafile:
# Swap pdxTrees for the name of your data
usethis::use_data(pdxTrees, overwrite = TRUE)- I ran the code in
DATASET.R, which created a new folder calleddatathat contains the cleaned data file.
Step 4: Create the documentation/help file for the data.
- Within the R folder, I created a script file,
pdxTrees.R. - I then added
roxygencomments to the file. See the Object Documentation Chapter of R packages.
- I ran
devtools::document(), which created themanfolder and anRdhelp file.
- I ran
?pdxTreesin the console to view the help file.
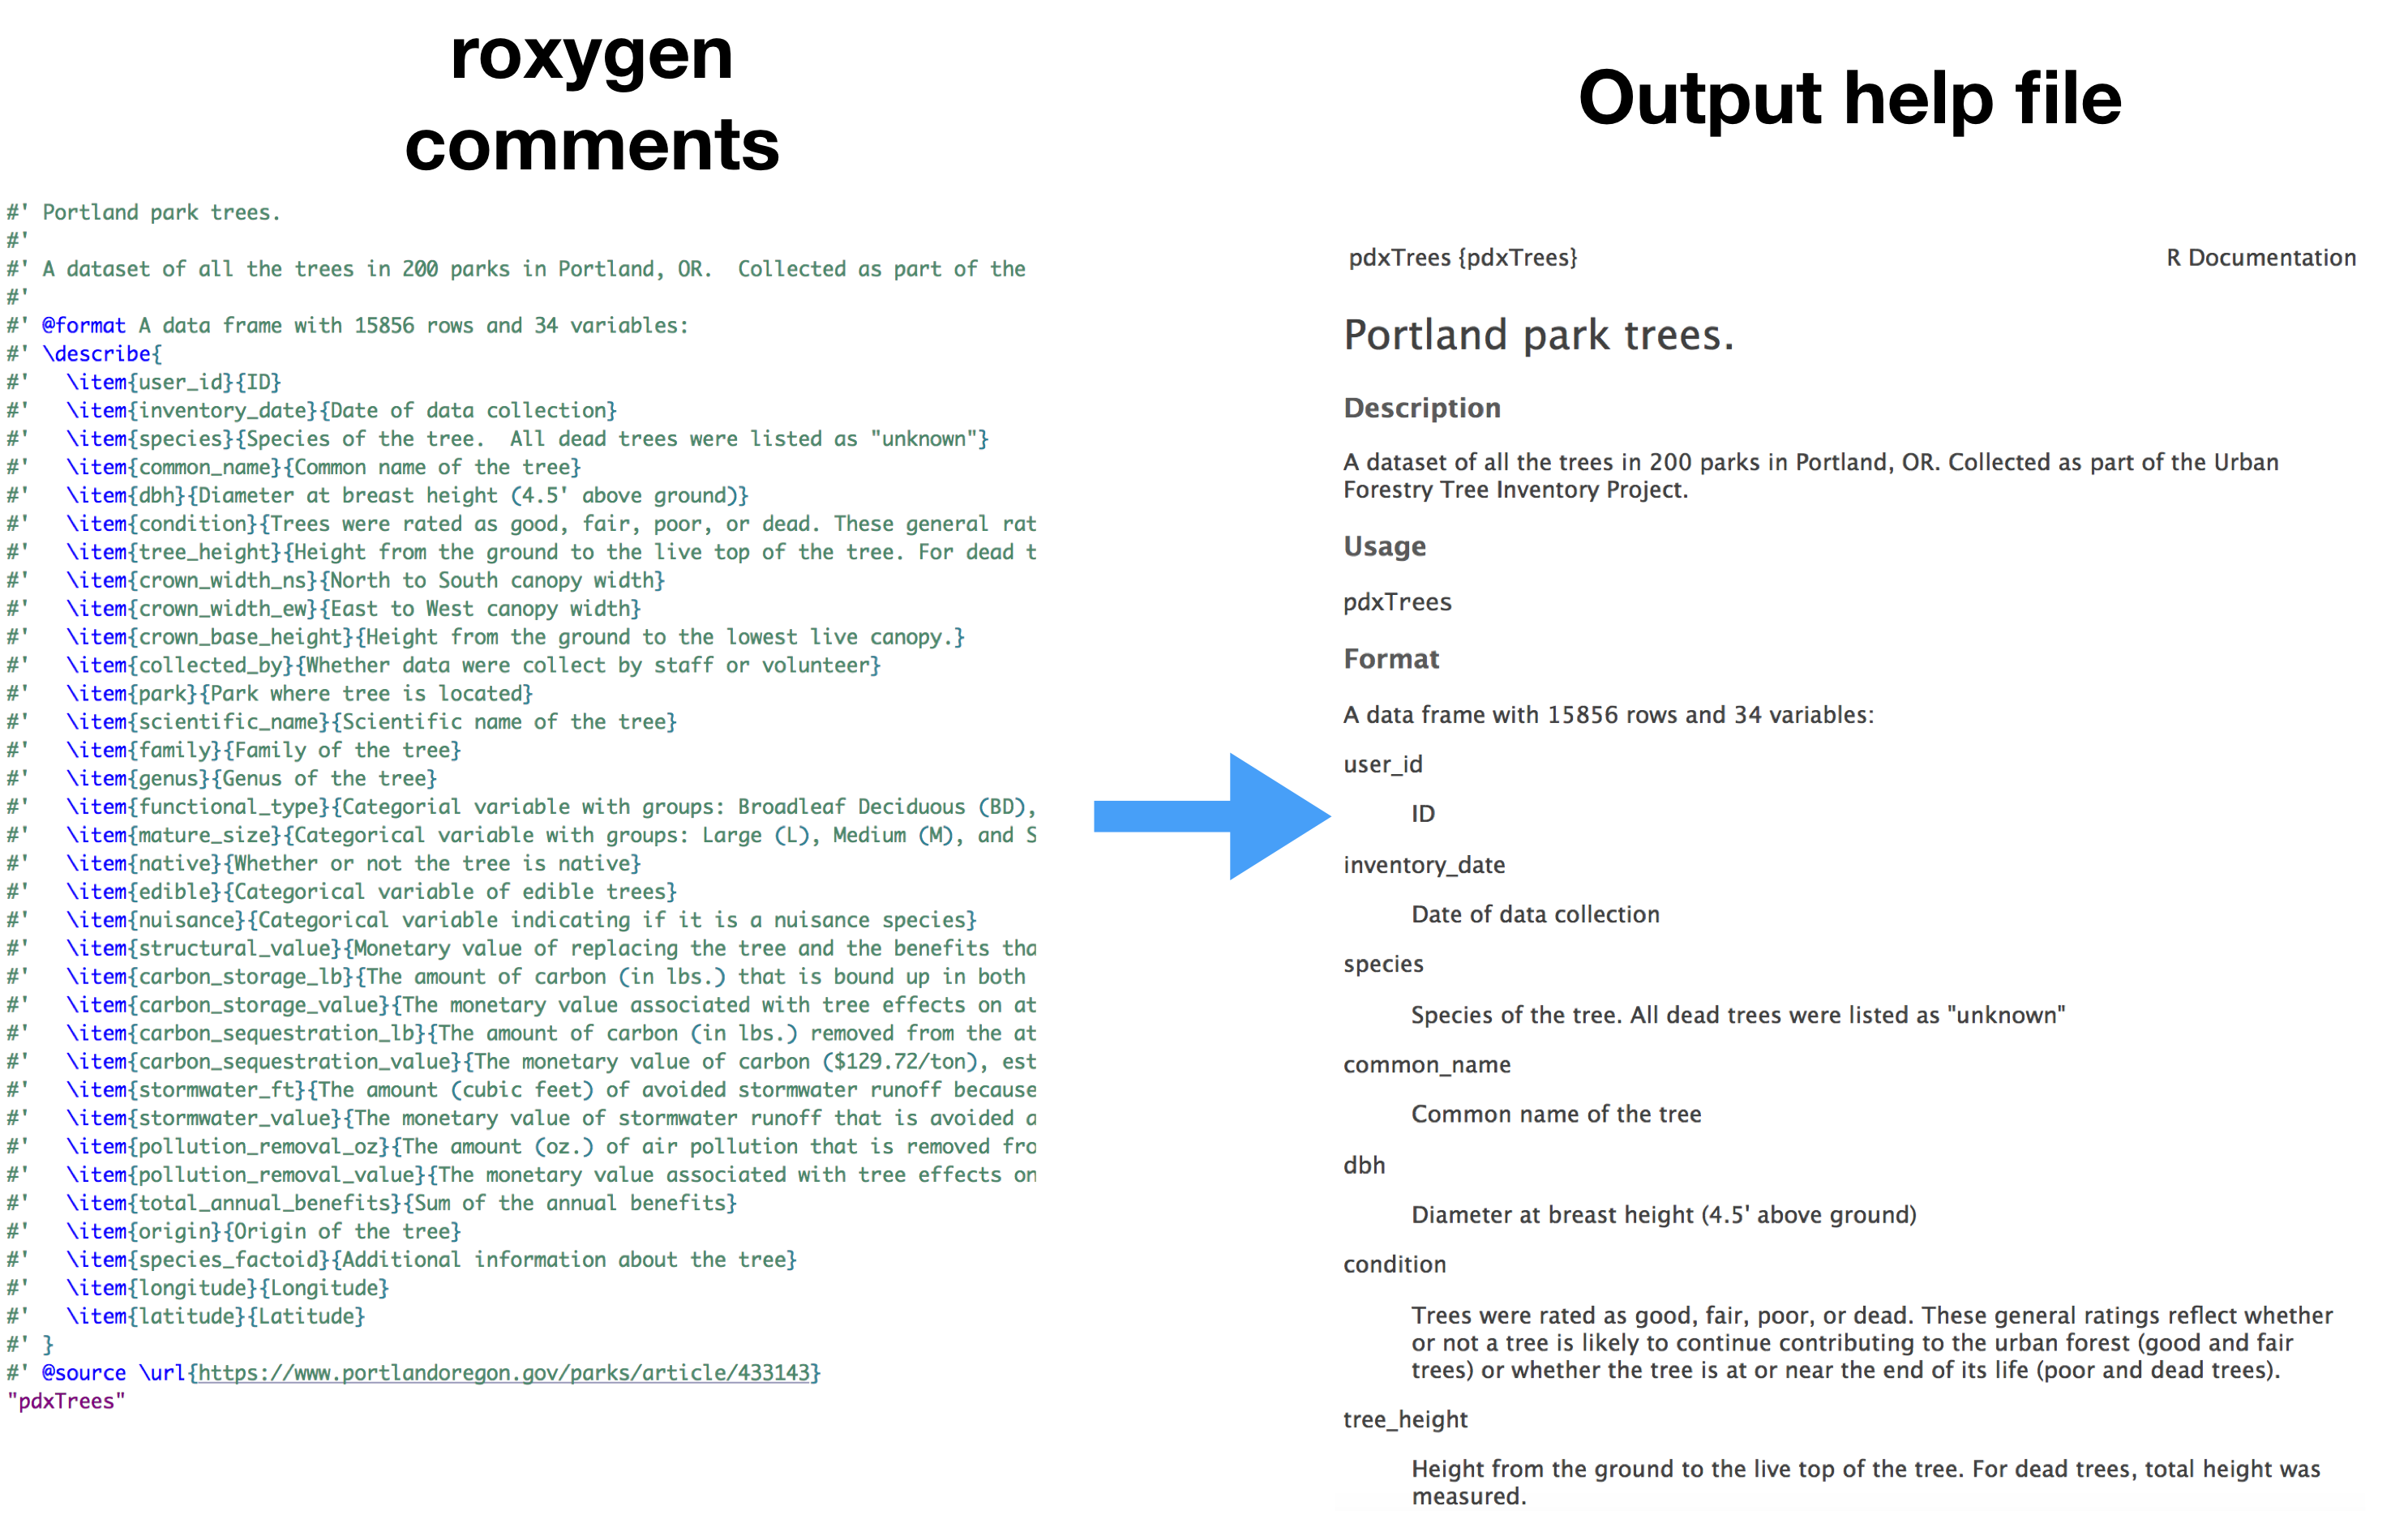
- Notice that I included the dataset name as a string in the bottom of the R script. If you forget this, the help file for that dataset won’t be created!
Step 5: Edit the DESCRIPTION file and consider creating a Readme file. The code usethis::use_readme_md(open = interactive()) generates a skeleton Readme file.
Step 6: Delete any extraneous files, such as hello.R and run checks with devtools::check(document = FALSE) to make sure the package compiles without errors or warnings.
Step 7: Push the changes to the public GitHub repository and now pdxTrees is ready to share with the world!
Load the data
If you are teaching with an RStudio Server, packages can be installed for all users. If your students are using local installations of R or RStudio, then they will need to do the following commands once to install the data package pdxTrees (one time only).
install.packages("devtools")
devtools::install_github("mcconvil/pdxTrees")
Once the package is installed, students load the library every time they want to access it.
library(pdxTrees)
dplyr::glimpse(pdxTrees)
## Rows: 15,856
## Columns: 34
## $ user_id                    <dbl> 1, 2, 3, 4, 5, 6, 7, 8, 9, 10, 11, 12, 1...
## $ inventory_date             <date> 2017-05-09, 2017-05-09, 2017-05-09, 201...
## $ species                    <chr> "PSME", "PSME", "CRLA", "QURU", "PSME", ...
## $ common_name                <chr> "Douglas-fir", "Douglas-fir", "Lavalle h...
## $ dbh                        <dbl> 37.4, 32.5, 9.7, 10.3, 33.2, 32.1, 28.4,...
## $ condition                  <chr> "Fair", "Fair", "Fair", "Poor", "Fair", ...
## $ tree_height                <dbl> 105, 94, 23, 28, 102, 95, 103, 105, 97, ...
## $ crown_width_ns             <dbl> 44, 49, 28, 38, 43, 35, 40, 45, 56, 35, ...
## $ crown_width_ew             <dbl> 57, 45, 27, 31, 44, 39, 40, 29, 45, 33, ...
## $ crown_base_height          <dbl> 4, 4, 3, 5, 4, 12, 6, 13, 5, 17, 6, 6, 4...
## $ collected_by               <chr> "staff", "staff", "staff", "staff", "sta...
## $ park                       <chr> "Gammans Park", "Gammans Park", "Gammans...
## $ scientific_name            <chr> "Pseudotsuga menziesii", "Pseudotsuga me...
## $ family                     <chr> "Pinaceae", "Pinaceae", "Rosaceae", "Fag...
## $ genus                      <chr> "Pseudotsuga", "Pseudotsuga", "Crataegus...
## $ functional_type            <chr> "CE", "CE", "BD", "BD", "CE", "CE", "CE"...
## $ mature_size                <chr> "L", "L", "S", "L", "L", "L", "L", "L", ...
## $ native                     <chr> "Yes", "Yes", "No", "No", "Yes", "Yes", ...
## $ edible                     <chr> NA, NA, NA, NA, NA, NA, NA, NA, NA, NA, ...
## $ nuisance                   <chr> NA, NA, NA, NA, NA, NA, NA, NA, NA, NA, ...
## $ structural_value           <dbl> 10101.06, 7900.55, 1111.03, 525.26, 8224...
## $ carbon_storage_lb          <dbl> 2578.6, 1968.6, 248.2, 320.1, 2026.7, 18...
## $ carbon_storage_value       <dbl> 167.26, 127.69, 16.10, 20.76, 131.46, 12...
## $ carbon_sequestration_lb    <dbl> 29.4, 25.0, 11.8, 4.8, 25.6, 24.7, 21.4,...
## $ carbon_sequestration_value <dbl> 1.91, 1.62, 0.77, 0.31, 1.66, 1.60, 1.39...
## $ stormwater_ft              <dbl> 136.9, 121.1, 32.3, 34.9, 105.2, 77.7, 9...
## $ stormwater_value           <dbl> 9.15, 8.09, 2.16, 2.33, 7.03, 5.19, 6.07...
## $ pollution_removal_value    <dbl> 24.44, 21.62, 5.76, 6.22, 18.78, 13.87, ...
## $ pollution_removal_oz       <dbl> 44.8, 39.7, 10.6, 11.4, 34.5, 25.4, 29.7...
## $ total_annual_benefits      <dbl> 35.50, 31.34, 8.69, 8.86, 27.47, 20.66, ...
## $ origin                     <chr> "North America - from British Columbia s...
## $ species_factoid            <chr> "Bracts on cones look like a mouse's fee...
## $ longitude                  <dbl> -122.6936, -122.6938, -122.6942, -122.69...
## $ latitude <dbl> 45.57491, 45.57489, 45.57493, 45.57490, ...- Encourage students to check out the help file to learn about the different variables in the data set.
?pdxTreesPlaying with pdxTrees
Here’s an example of a leaflet visualization of the trees. In this example, I ask my students to create a map of the Japanese flowering cherry trees and to label the park that contains the tree. If you zoom in along the waterfront, you will notice that the Gov Tom McCall Waterfront Park is a great place to experience the cherry blossoms!
# Load libraries
library(tidyverse)
library(leaflet)
library(pdxTrees)

# Find the Japanese flowering cherry tree
cherry_blossoms <- pdxTrees %>%
  filter(common_name == "Japanese flowering cherry")

# Create a map of the trees and label the park
m <- leaflet(cherry_blossoms) %>%
  addTiles() %>%
  addMarkers(~ longitude, ~ latitude, popup = ~ park)
mSummary
Data packages are straightforward ways for instructors to make data and codebooks available for their students. They help model an appropriate level of data curation by integrating the codebooks and other meta data related to the dataset. They also facilitate the use of rich, real-world data sources.
Because data packages are often simpler than full-fledged R packages, they provide an accessible way for instructors, and even students, to develop a package as a way to organize and document data that they might be ingesting and curating.
The devtools, roxygen2, and usethis packages facilitate and automate much of the package creation process.
Kelly McConville is an assistant professor of statistics at Reed College in Portland, OR. At Reed, she teaches a variety of statistics and data science courses. As a firm believer that undergraduate research enhances the educational experience, she involves students in forestry data science research and co-chairs two national programs: the Undergraduate Statistics Project Competition (USPROC) and the Electronic Undergraduate Statistics Research Conference (eUSR). She’d love to see your students submit their work to USPROC and eUSR!
Learn more
- pdxTrees package home
- RStudio Package Development Cheat Sheet
- R packages by Hadley Wickham
- In particular, the chapter on Data
- Package Development Tutorial
- Creating a package for your dataset
- Another great example of creating a data package
About this blog
Each day during the summer of 2019 we intend to add a new entry to this blog on a given topic of interest to educators teaching data science and statistics courses. Each entry is intended to provide a short overview of why it is interesting and how it can be applied to teaching. We anticipate that these introductory pieces can be digested daily in 20 or 30 minute chunks that will leave you in a position to decide whether to explore more or integrate the material into your own classes. By following along for the summer, we hope that you will develop a clearer sense for the fast moving landscape of data science. Sign up for emails at https://groups.google.com/forum/#!forum/teach-data-science (you must be logged into Google to sign up).
We always welcome comments on entries and suggestions for new ones. However, comments on the blog should be constructive, encouraging, and supportive. We reserve the right to delete comments that violate these guidelines.
