Statistics for science
Figuring out truth is really hard to do. Teaching students how to attempt it may be even harder. As statisticians we know that statistical significance isn’t truth, but we still hope that the process by which we analyze data will lead us on a path toward scientific discovery. How do we teach students the best way to stay on the path of using statistics to move science forward? Teaching about p-values has always been hard, but it is especially hard when there is so much controversy surrounding any use of p-values at all.
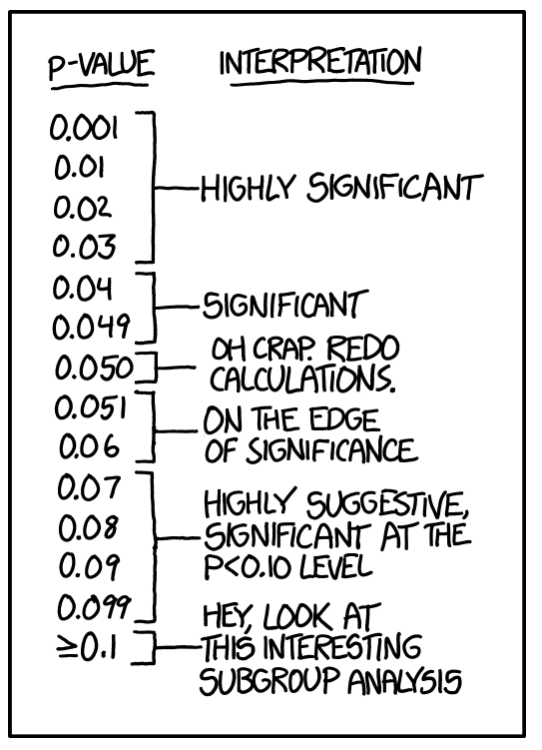
In 1929, Fisher (“The statistical method in psychical research”. Proceedings of the Society for Psychical Research. 1929;39:189–192.) wrote that .05 was an “arbitrary, but convenient” criteria for determining what to ignore. That is, Fisher did not consider a p-value to determine the truth of a scientific claim, rather it was a method for knowing which lines of scientific inquiry to drop.
An observation is judged significant, if it would rarely have been produced, in the absence of a real cause of the kind we are seeking. It is a common practice to judge a result significant, if it is of such a magnitude that it would have been produced by chance not more frequently than once in twenty trials. This is an arbitrary, but convenient, level of significance for the practical investigator, but it does not mean that he allows himself to be deceived once in every twenty experiments. The test of significance only tells him what to ignore, namely all experiments in which significant results are not obtained. He should only claim that a phenomenon is experimentally demonstrable when he knows how to design an experiment so that it will rarely fail to give a significant result. Consequently, isolated significant results which he does not know how to reproduce are left in suspense pending further investigation.
The American Statistical Association has put out a Statement on Statistical Significance and p-values which can serve as a template for what your students should believe about p-values. Recently, the New England Journal of Medicine has put out New Guidelines for Statistical Reporting in the Journal based on the ASA’s reports.
- P-values can indicate how incompatible the data are with a specified statistical model.
- P-values do not measure the probability that the studied hypothesis is true, or the probability that the data were produced by random chance alone.
- Scientific conclusions and business or policy decisions should not be based only on whether a p-value passes a specific threshold.
- Proper inference requires full reporting and transparency.
- A p-value, or statistical significance, does not measure the size of an effect or the importance of a result.
- By itself, a p-value does not provide a good measure of evidence regarding a model or hypothesis.
Of course, the topic would not be so heated if it were not also nuanced. Below we provide some details of the sides, but our blog is not nearly long enough to include a thorough treatment of the details of both sides. We encourage you to bring up the debate in class and have your students argue one side or another. If each student researches one small detail of the conversation, your class discussion can be incredibly rich and interesting.
(note: The following interpretation of p-values and type I vs type II errors is credited to Roger Peng’s musings during an episode of Not So Standard Deviations, see our write up here.)
The case for p-values (worries about type I errors)
The case for p-values centers around the idea that without p-values, making scientific claims is even harder to do than if we use them. Indeed, the human eye is drawn toward seeing trends, especially if the human has a vested interest in the research result!
In 2016, the journal Basic and Applied Social Psychology banned the use of p-values and other measures of statistical significance (e.g., confidence intervals). Fricker et al. look back at one year of articles in BASP after the ban. They “found multiple instances of authors overstating conclusions beyond what the data would support if statistical significance had been considered. Readers would be largely unable to recognize this because the necessary information to do so was not readily available…In our opinion, the practices we have observed in the papers published in BASP post-ban will not help to solve this problem; in fact, we believe they will make it worse.”
Indeed, Ioannidis makes a huge case for the worry about type I errors in his article on Why Most Published Research Findings are False (which has now been viewed almost 3 million time). That is, without some (or rather, strict!) control on the false positive rate, there is no good mechanism for a reader to distinguish between a true result and a false positive.
The case against p-values (worries about type II errors)
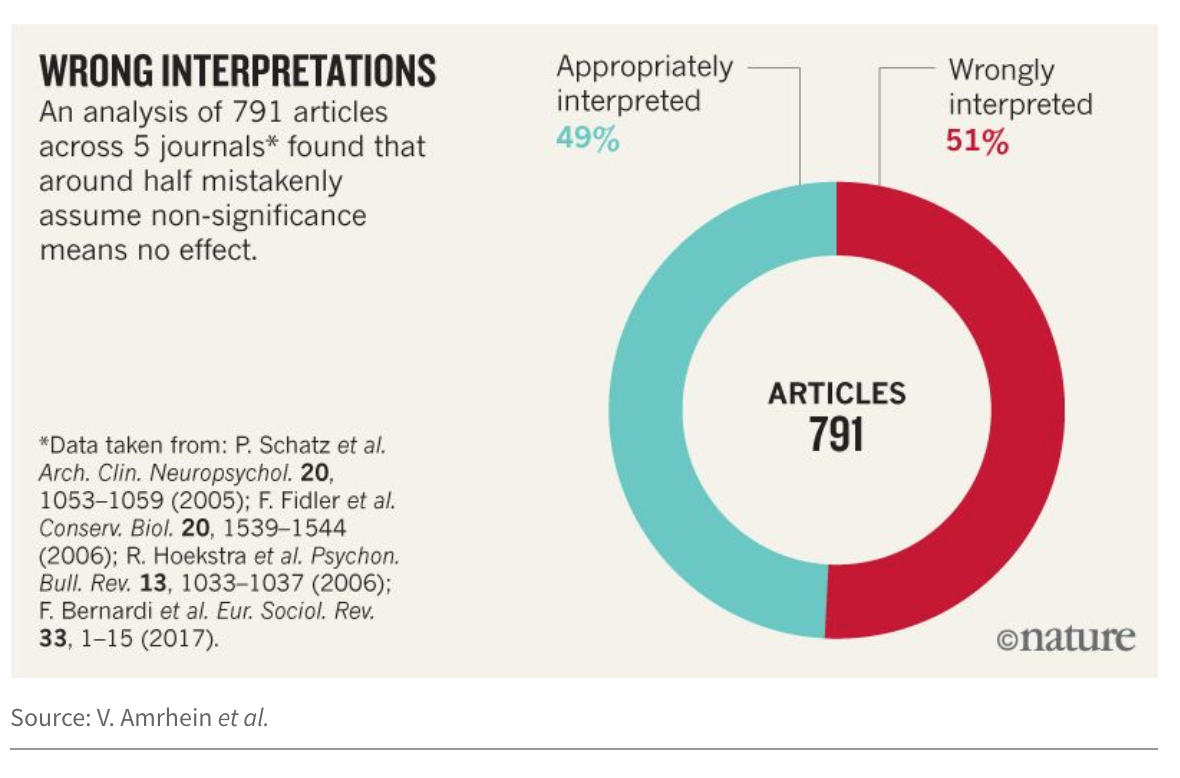
The case against p-values focuses on type II errors. Amrhein et al. (including 800+ signatories) call for an end to using statistical significance in scientific reporting. Their main concern is in interpreting non-significant results as “no difference.” The key to their argument (and the argument of many of those who warn against using p-values) is that the crux of the problem lies in the dichotomization of the p-value (into two groups: significant and non significant). Indeed, they accurately report on the vast problem of incorrect interpretations of “large” p-values indicating no effect.
ATOM
We appreciate the editorial in The American Statistician, “Moving to a World Beyond p < 0.05” by Wasserstein, Schirm, and Lazar. Instead of focusing only on the “don’ts”, they provide guidance on how statistical inference can be used effectively through the acronym ATOM.
- Accept uncertainty, and be
- thoughtful,
- open, and
- modest
Indeed, being thoughtful, open, and modest leads to one important “don’t” recommendation from Wasserstein et al. which is:
‘statistically significant’ – don’t say it and don’t use it.
Teaching the conversation
While it may seem like an additional topic to cover in an already packed introductory statistics curriculum, we suggest that teaching about the conversation around p-values not only helps students understand the meaning of a p-value, but the information is part of the larger context necessary for doing ethical data science. One possible assignment would be for each student to choose a different journal article / editorial / newspaper article and present the issue in the article in either writing or as a brief in-class presentation. A possible structure to the presentation might be:
- An introduction / motivation to the problem. Why did the authors decide to tackle the problem you are about to tell us?
- The specific problem which you will address.
- The logical argument, derivation, proof etc. The main gist of your paper is to convince the reader that the specific issue presented in your article is true (or false if your goal is to discount the author’s claim). Using what you know about statistics (and multiple comparisons) as well as what the paper argues, convince the reader. Again, be sure to cite anything that is not your own idea.
- Conclusion / discussion. Contextualize your result in the general field of natural science, social science, or medicine.
Some possible papers for students to work with include the following list:
- Why Most Published Research Findings Are False
- [Is everything we eat associated with cancer? A systematic cookbook review] (http://ajcn.nutrition.org/content/97/1/127.long)
- P values, hypothesis testing, and model selection: it’s deja vu all over again
- In defense of p-values
- The common sense of P values
- To P or not to P?
- P values are only an index to evidence: 20th‐ vs. 21st‐century statistical science
- Moving to a World Beyond “p<0.05”
- What Have We (Not) Learnt from Millions of Scientific Papers with P Values?
- Why is Getting Rid of P-Values So Hard? Musings on Science and Statistics
- Correcting Corrupt Research: Recommendations for the Profession to Stop Misuse of p-Values
- Before p<0.05 to Beyond p<0.05: Using History to Contextualize p-Values and Significance Testing
- The Limited Role of Formal Statistical Inference in Scientific Inference
- Valid P-Values Behave Exactly as They Should: Some Misleading Criticisms of P-Values and Their Resolution With S-Values
- The p-Value Requires Context, Not a Threshold
- Putting the P-Value in its Place
- Abandon Statistical Significance
- Five Nonobvious Changes in Editorial Practice for Editors and Reviewers to Consider When Evaluating Submissions in a Post p<0.05 Universe
- Coup de Grace for a Tough Old Bull: “Statistically Significant” Expires
- Assessing the Statistical Analyses Used in Basic and Applied Social Psychology After Their p-Value Ban
- The earth is flat (p > 0.05): significance thresholds and the crisis of unreplicable research
Learn more
- ASA’s Statement on Statistical Significance and p-values
- Special issue of The American Statistician on p-values
- ASA President Karen Kafadar’s regular President’s Corner in Amstat News reflects on p-values: Statistic and Unintended Consequences
- March 20, 2019, Nature editorial on ditching statistical significance.
- Andy Zieffler’s blog reflecting on What to do about p-values in the classroom.
About this blog
Each day during the summer of 2019 we intend to add a new entry to this blog on a given topic of interest to educators teaching data science and statistics courses. Each entry is intended to provide a short overview of why it is interesting and how it can be applied to teaching. We anticipate that these introductory pieces can be digested daily in 20 or 30 minute chunks that will leave you in a position to decide whether to explore more or integrate the material into your own classes. By following along for the summer, we hope that you will develop a clearer sense for the fast moving landscape of data science. Sign up for emails at https://groups.google.com/forum/#!forum/teach-data-science (you must be logged into Google to sign up).
We always welcome comments on entries and suggestions for new ones.