Intro
Hello!
It’s my distinct pleasure to be guest-blogging for you today! My name is Kelly Bodwin and I’m an Assistant Professor of Statistics at Cal Poly, San Luis Obispo. In my two years at Cal Poly I have taught
- Stat 218 - An introductory course for non-majors
- Stat 419 - An upper-level course in multivariate analysis
- Stat 331 - Our department’s introductory R class
In all of these courses, I make extensive use of R. Despite the huge differences in the experience level of the students, the course objectives, and the prerequisite knowledge required, I’ve found that some key principles have guided me in how I ease programming into a statistics classroom. I’d like to share a few of these tips with you today.
The Quick Tips
My goal in this post is not to focus on the nitty-gritty of teaching pure programming, nor to give advice that is specific to any one language. (Since I use R, and it is the lingua franca of this blog, my examples will all be in R.) Rather, I want to share a few high-level ideas and philosophies that have helped me refine my courses, so that the presence of code in a non-coding class isn’t too big of a hurdle for students. (This entry builds on the prior blog entry on R Style guides.)
In a nutshell, my five quick tips include:
- Define your terms.
- Establish basic coding vocabulary, such as object types, early on.
- Be deliberate about teaching versus bypassing peripheral skills.
- Use tools like RStudio Cloud, R Markdown, and
usethisto shelter students from setup.
- Use tools like RStudio Cloud, R Markdown, and
- Read code like English.
- The best way to debug is to read your process out loud as a sentence.
- Require good coding practices from Day One.
- Save a headache - add “Code Style” to your grading rubric.
- Leave room for creativity.
- Open-ended questions let students explore and shine.
And away we go!
1. Define your terms.
Quick: What is the difference between R, RStudio, and R Markdown?
What about the console, a script, and the environment?
A function, a variable, and an input option? A data frame, list, or matrix, vector, or tibble???
Perhaps you are thinking, “Psh, of course I know what these things are. I’m reading a Data Science blog, after all.” But can you explain them to a student? One who has never seen a single line of code?
In my experience, the hardest topics to teach are the ones that feel like second nature. Maybe you answered the first question with, “R is a language, while RStudio is an IDE.” Correct! But does your student know what an IDE is? Or even what makes something a programming language?
(Author’s note: I definitely did NOT just have to Google “IDE” to learn that it stands for Integrated Development Environment…)
There are plenty of resources out there to help you demystify concepts in a way that is accessible to beginners. (Some suggestions are linked at the end of this post.) For example, I’m particularly fond of this analogy, from the Modern Dive textbook:
| R: A new phone | R Packages: Apps you can download |
|---|---|
 |
 |
However, the demystifying step is integral to the learning process. It may be tempting to jump right in to what you may think is more important or interesting - but if you skip over the basic building blocks that seem obvious to you, the important stuff becomes difficult to explain. For example, suppose a student comes to you with the following code:
dat <- data.frame(
  x = 1:10
)

mean(dat)
How will you explain what went wrong? My first response to this mistake (which I see frequently) is to ask, “What type of input did the function expect?” (a numeric vector) “What type of input did you give the function?” (a data frame)
The above example leads to a smooth debugging process, but it requires that the student has a basic grasp of what “function input” and “data types” are, neither of which is everyday knowledge for a student new to programming.
I’m not advocating for replacing cool, modern, interactive data analysis with flash cards and vocab tests. Just be aware of the words you are using that may not yet have meaning to your audience.
2. Be deliberate about teaching or bypassing peripheral skills.
There are some things that need to happen before a student is able to start actually writing code. For my classes, we used to follow the seven steps below before we could really do any work in R.
- Download and install R
- Download and install RStudio
- Install packages.
- Create an R Markdown file.
- Load packages.
- Load the dataset.
- Save your work and/or data in a reasonable folder.

Ask yourself: Which of these skills are part of the learning objectives of the course? Which are necessary background for them to move forward in their studies? Ideally, the focus should be on the learning objectives, as other unneeded steps are often a confusing distraction.
Steps 1, 2, & 3 can be bypassed with cloud environments, so students don’t have to get set up R on their personal computers. (I recommend RStudio Cloud: see the related blog entry here: https://teachdatascience.com/cloud.) Steps 4, 5, & 6 can be bypassed by supplying source documents in R Markdown (see https://teachdatascience.com/rmarkdown), including scaffolding code for package and dataset management. For step 7, the usethis package is a blessing!
Here is my personal checklist of peripherals skills including which ones I include in introductory courses:
| Course Type | Install/Update R and RStudio | R Markdown fluency | Package management | Data management | File and folder organization | GitHub |
|---|---|---|---|---|---|---|
| Intro Stat for Non-Majors | ⚠️ | ⚠️ | ❌ | ❌ | ❌ | ❌ |
| Intro Stat for Majors | ✅ | ✅ | ⚠️ | ⚠️ | ⚠️ | ⚠️ |
| Advanced Statistics | ✅ | ✅ | ✅ | ✅ | ⚠️ | ⚠️ |
| Intro to Statistical Computation | ✅ | ✅ | ✅ | ✅ | ✅ | ✅ |
Whatever elements you choose to emphasize or “erase” in class creation, choose purposefully! It is worth the effort to remove as much complication as possible from the coding process, leaving brain space and class time for target topics (see also the ‘Less Volume, More Creativity’ entry).
3. Read code like English.
When seeing code for the first time, symbols and syntax can be as mystifying as alien hieroglyphics. A good first habit to impart to students - and to model in your speech - is reading code out loud in lay terms. After all, we don’t call them “programming languages” for nothing.
For example, in R, the pipe (%>%) is typically read as “then”.
Consider the following example:
titanic %>%
  filter(Gender == "male") %>%
  mutate(
    logFare = log(Fare)
  ) %>%
  ggplot(aes(x = Passenger.Class, y = logFare)) + geom_boxplot()
Explaining the code to a fellow statistician, I might say:
Take the dataset
titanic, then narrow it down to only male-identified passengers, then calculate the log of the fares, then visualize the fares paid by each travel class.
For beginning students, I usually get more specific. First, I will often read code as a “request” to the computer, to emphasize that code will only do exactly what you tell it to. Second, I will use the function verbs and variable names in my sentence, to reference where each step happens in code.
Hey R, please take the dataset called
titanicand filter down to only rows whereGenderis “male”.
Then mutate the dataset to include a variable called
logFarethat contains log of the fares paid each passenger.
Then use these results to generate a plot comparing
Passenger.ClassandlogFare, in the form of boxplots.
When students have practice “translating” their code - or at least, if they have heard you do it enough to emulate it - you can trick them into debugging their own code by simply reading aloud. My most common response to a student question of “Why doesn’t my code work?” is, “Talk me through what you asked the computer to do.”
Here is a common mistake I see in student code:
titanic %>%
  filter(Gender == "male") %>%
  logFare = log(Fare)
The conversation usually goes like this:
Student: My code doesn’t work.
Me: Talk me through your steps. What did you do to the dataset first?
Student: I filtered it to males.
Me: Then what did you do to the dataset?
Student: I logFare …. Oh, I’m supposed to mutate it!
The instant their spoken sentence landed on “logFare” without a verb in between, the issue was flagged!
4. Require good coding practices from day one.
My first time teaching introductory statistical computing, I made the mistake of saying something I will never say again:
If your code works correctly, you will not lose points.
Hoo boy, did I regret that.

Me @ my former self.
Putting aside all noble thought of training responsible coders and imparting principles of readability - my instruction created a scenario where it was a nightmare to help students debug code.
# Find the typo, I dare you.

var1<-titanic%>%select(Sex,Passenger.Class,Fare)%>%filter(Sex=="Female")%>%filter(Passenger.Class==3)%>%pull(Fare)
var2<-titanic%>%select(Fare,Sex,Passenger.Class)%>%filter(Passenger.Class=3)%>%filter(Sex=="Male")%>%pull(Fare)
pv=t.test(var1,var2,"greater",0.1)$p.value
These days, I regularly rant about readability, reproducibility, and the importance of clear code.
Here is a great talk by Jenny Bryan on how to recognize “good” code.
Hint: Students are grade-motivated.
The new mantra in my courses is:
Code that works is not necessarily good code.

Fortunately, it is easy to sneak good coding practice into the course objectives. I strongly recommend including STYLE within a formal grade rubric on all exams and homeworks. Both Google and Hadley Wickham have great style guides for programming in R, and we discuss some of the important features in a previous blog on R style guides.
For me, good coding practice includes:
- Clear code formatting
- Object names follow consistent conventions
- Lack of unnecessary code repetition
- Reproducibility
- Unit tests before large calculations
- Commenting and/or documentation
Of course, the level of formality you expect will vary by class. In an introductory non-major class, good coding accountability may be as simple as taking off points for hard-coding or poorly named variables. The example below represents the kind of error that is common among beginners:
mean(titanic$Fare)
## [1] 32.30542

xbar <- 32.3
In a coding-focused class, you may enforce rigorous levels of reproducibility, like setting seeds and dealing with working directories. In any case, even a 5 point penalty out of 100 is enough to get students thinking about their style.
5. Leave room for creativity.
I’m frequently asked,
“Why do you use R in intro classes? Why not stick to applets or point-and-click?”
It’s a reasonable question. After all, the overhead on interweaving coding with a statistics class is non-trivial. (I mean, heck, you just read a whole blog post of advice on teaching statistics that had exactly zero statistical content.)
If there’s one message I can leave you with, it’s this:
Students can do so much more than they realize. Give them the tools to creatively explore data, and they will surprise you!
Anecdotal evidence is fun
I would like to provide one last example. I teach an introductory class for non-majors, “Introduction to Statistics for the Life Sciences”. For many of the students, my course is the one mathematical class they have to survive to achieve their Life Science major. When they learn there is a coding element to the course, they are scandalized.
The last R assignment of the year involves a dataset of baby name counts in the United States. At the end, students are asked to
Choose your own name(s) and do an analysis.
Most simply select their own name, and follow all the steps in my example. But just getting to choose their own name was exciting for them. There was a lot of buzz in the room as they laughed about whose names are getting more popular, whose are going out of style, and whose have swapped genders.
Some took it a step further and got creative with their name choices and plot design. Here is my favorite example, from a student who had never seen a line of code before entering my class:
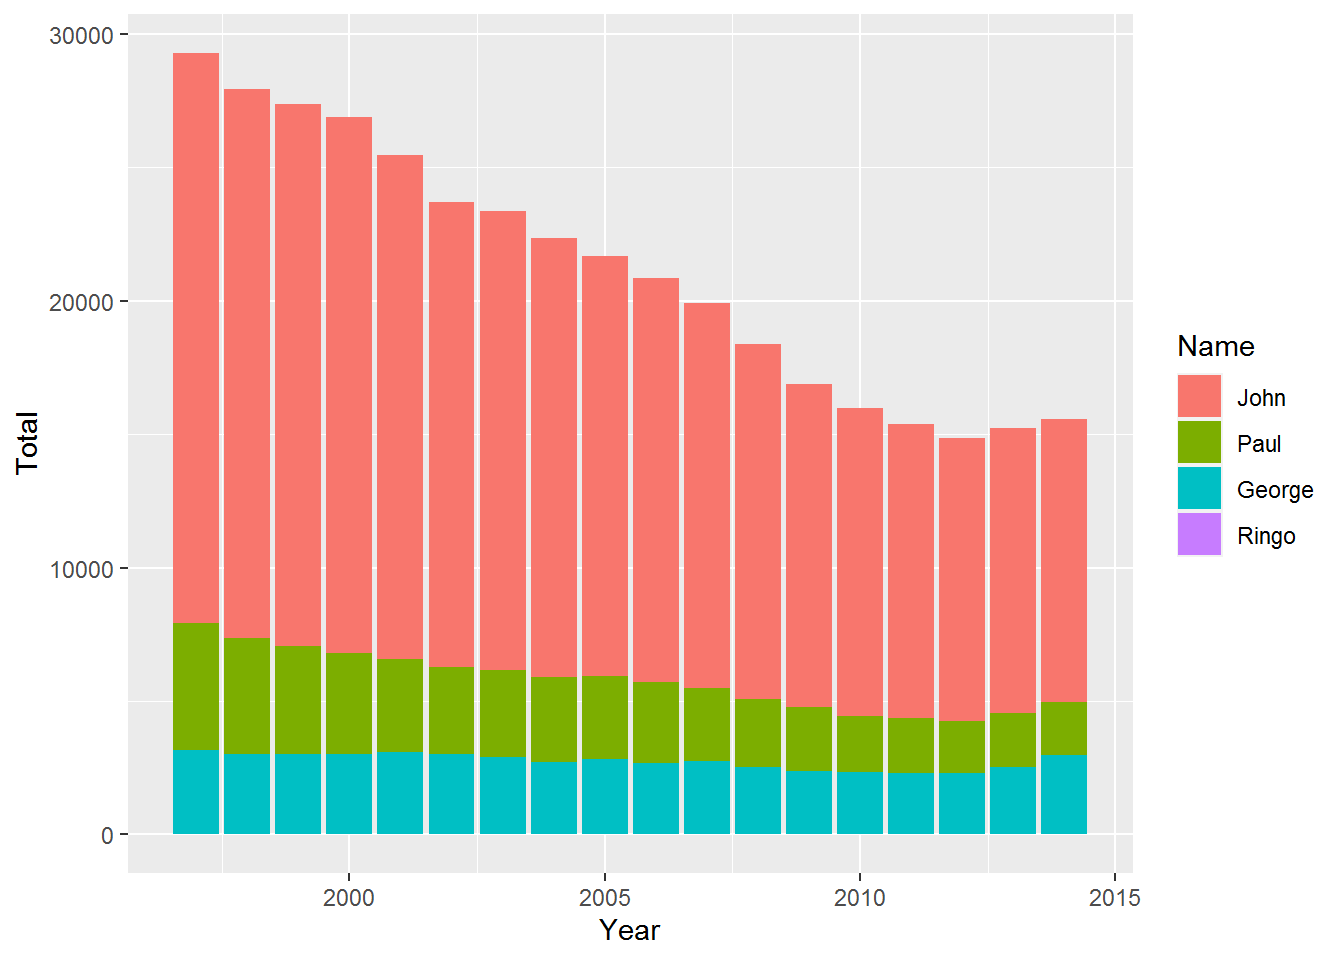
Not bad for a first-time coder!

Signing off
I hope these quick thoughts give you a few new ideas or cautionary tales about how to incorporate coding into your class. Guiding new students through the complications of coding is no small task, but the payoff in their ability to independently create results is enormous.
If nothing else, remember: Every mistake is a new tip to discover! All the advice in this blog was born of something gone wrong, and the solutions I’ve found are the result of trial-and-error. Perhaps I’ll be back next summer with “5 More Quick Tips” to share.
- Kelly Bodwin
Learn more
- Find Kelly on twitter at @kellybodwin, github.com/kbodwin, and calpoly.edu/~kbodwin
- R for Data Science online textbook
- Modern Dive online textbook
About this blog
Each day during the summer of 2019 we intend to add a new entry to this blog on a given topic of interest to educators teaching data science and statistics courses. Each entry is intended to provide a short overview of why it is interesting and how it can be applied to teaching. We anticipate that these introductory pieces can be digested daily in 20 or 30 minute chunks that will leave you in a position to decide whether to explore more or integrate the material into your own classes. By following along for the summer, we hope that you will develop a clearer sense for the fast moving landscape of data science. Sign up for emails at https://groups.google.com/forum/#!forum/teach-data-science (you must be logged into Google to sign up).
We always welcome comments on entries and suggestions for new ones.