Watching an expert work through a data analysis using the tidyverse
Teaching Data Science is challenging since it involves teaching the entire data science analysis cycle. While it’s helpful for students to experience this process, they can often feel at sea in terms of the decisions they need to make and the iterative process of exploration, modeling, summarization.
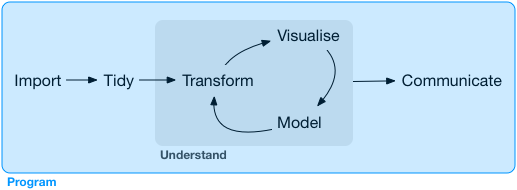
We’ve been using the data science cycle promulgated by Hadley Wickham and Garrett Grolemund (both from RStudio) that was published in their excellent book: R for Data Science, https://r4ds.had.co.nz.
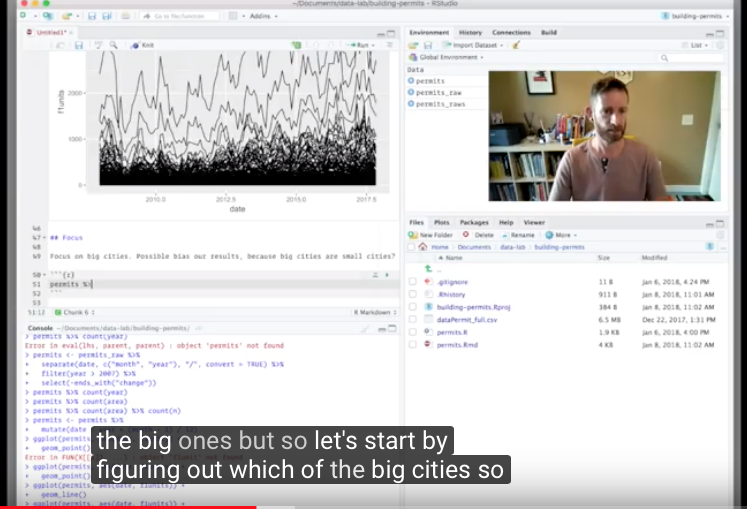
Back in 2018, Hadley recorded a video of his analysis of a dataset with the goal of demonstrating his workflow. I’ve found this remarkably illuminating viewing and have incorporated this into my Introductory Data Science class. I’ve shown the first five minutes or so of the video (https://www.youtube.com/watch?v=go5Au01Jrvs) then assigned the students to watch the remainder in the privacy of of their own room.
I like one of the comments:
Amazing to see Hadley’s approach and thinking. We need more videos like this. It also shows even Hadley makes silly mistake so remember its ok to get frustrated.
I find this screencast really interesting for a number of reasons:
- Hadley provides an oddly compelling stream of consciousness narrative (akin to a director’s commentary on a movie) that helps to clarify why he’s doing what he is doing
- He makes mistakes (quite a few). It’s humorous when he forgets the calling structures for routines he’s written. But it’s even more powerful that he shrugs off the mistake, corrects it, and moves forward. He’s a zen master of calm (see http://pamvictor.blogspot.com/2015/02/the-zen-of-improv-how-to-make-sweet.html for a lovely essay on how fear of making mistakes can paralyze us)
- We learn some cool idioms and approaches to data wrangling and exploration
- He’s having so much fun diving into the dataset: it’s wonderful to watch his unbridled excitement and his New Zealand accent.
- He shows off the power and flexibility of the tidyverse (see https://teachdatascience.com/tidyverse).
So far I’ve only had the students watch the video. Next time I might imagine having students explore an extension of the original data (https://github.com/hadley/building-permits) and communicate their results. Or even more ambitiously, give students a dataset where I’ve done some preliminary work and have them record a five minute screencast.
Learn more
About this blog
Each day during the summer of 2019 we intend to add a new entry to this blog on a given topic of interest to educators teaching data science and statistics courses. Each entry is intended to provide a short overview of why it is interesting and how it can be applied to teaching. We anticipate that these introductory pieces can be digested daily in 20 or 30 minute chunks that will leave you in a position to decide whether to explore more or integrate the material into your own classes. By following along for the summer, we hope that you will develop a clearer sense for the fast moving landscape of data science. Sign up for emails at https://groups.google.com/forum/#!forum/teach-data-science (you must be logged into Google to sign up).
We always welcome comments on entries and suggestions for new ones.