What is the Tidyverse?
The tidyverse is a coherent system of R packages for data wrangling, exploration and visualization that share a common design philosophy. These packages are intended to make statisticians and data scientists more productive by guiding them through workflows that facilitate communication, and result in reproducible work products. Unpacking the tidyverse, all that it means and contains, could easily take a dedicated book or blog in itself. Instead, what this post aims to do is give you an introduction and a clear, easy path forward to learning more. A very nice introduction and motivation can be found in this RStudio post and Hadley Wickham’s keynote address at the 2017 RStudio Conference.
Nowadays you can simply load the foundation of tidyverse packages with the following:
library(tidyverse)The above library statement loads the following tidyverse packages: readr, tibble, tidyr, dplyr, purrr, and ggplot2. Together these form the basis of the following popular data scientist workflow:
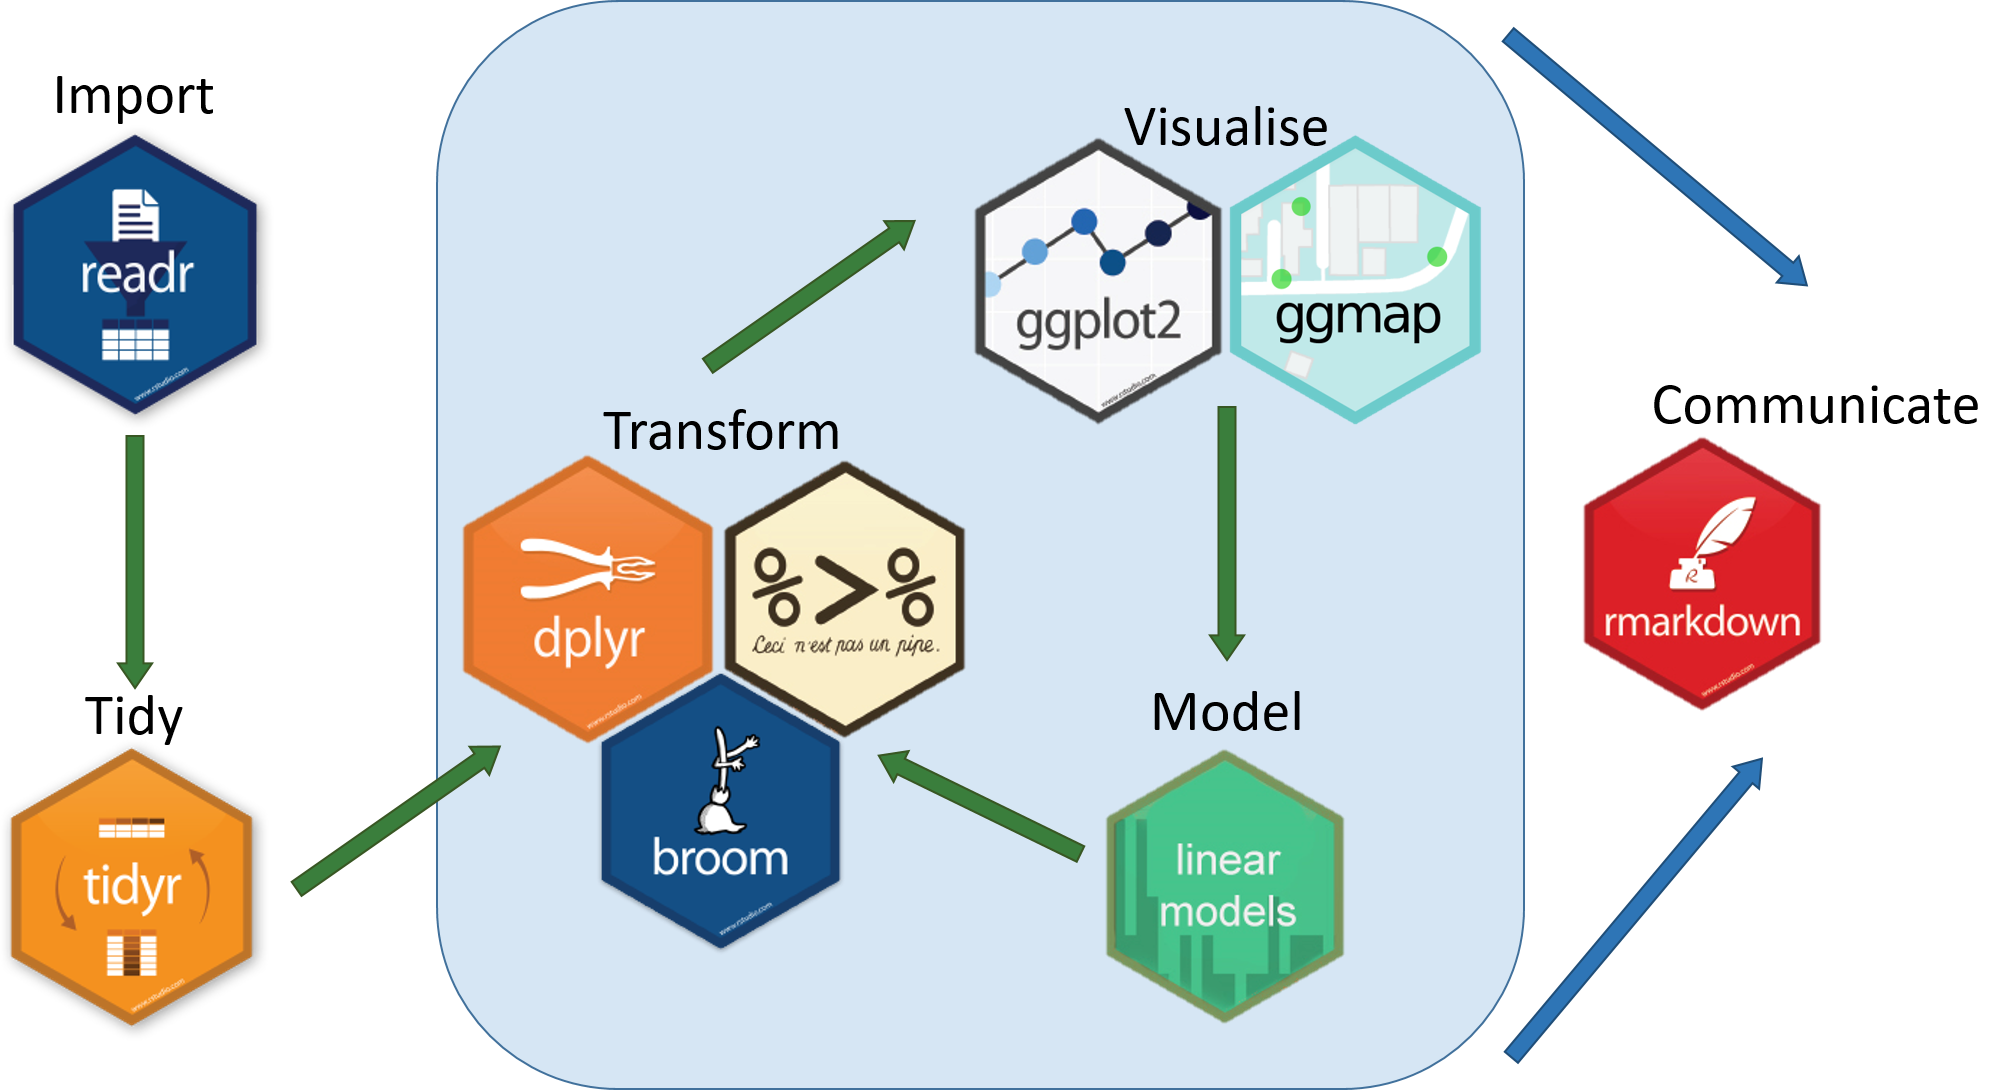
The tidyverse includes many other packages like stringr and lubridate which must be loaded explicitly.
Why Use The Tidyverse
One of the biggest reasons to learn the tidyverse is consistency. Throughout these packages, consistency comes in three primary forms:
The first formal argument of tidyverse functions is always a data frame that provides the function’s input.
The idea of tidy data: a data frame where each row is an observation and each column contains the value of a single variable.
The pipe operator,
%>%, guides the flow of operations on data.
The consistency of the tidyverse, together with the goal of increasing productivity, mean that the syntax of tidyverse functions is typically straightforward to learn. Function names like spread, gather, filter, group_by and so many others do exactly what they sound like and can be combined seamlessly with the pipe operator. As Hadley Wickham often quotes of Hal Abelson, “Programs must be written for people to read and only incidentally for machines to execute.” The third point above, concerning the pipe operator, deserves an introdution of its own which can be found here, but for now think of it as the way to chain your commands or functions together.
The computing workflow induced by the tidyverse necessarily means increased readability and reproducibility because functions are so organically named and every task can be so easily decomposed into single-function operations. Take the following example using the iris dataset which
Selects two variables of interest, then
Filters down to two of the three species, then
Groups by species, then
Summarizes each variable by computing means
iris %>%
  select(Petal.Length, Petal.Width, Species) %>%
  filter(Species %in% c("versicolor", "setosa")) %>%
  group_by(Species) %>%
  summarize(
    AvgPetalLength = mean(Petal.Length),
    AvgPetalWidth = mean(Petal.Width))
## # A tibble: 2 x 3
##   Species    AvgPetalLength AvgPetalWidth
##   <fct>               <dbl>         <dbl>
## 1 setosa               1.46         0.246
## 2 versicolor           4.26         1.33
The beauty of the code above is that it can actually be read exactly as the bullets above it are read, with the pipe operator being read as “then”. Contrast this to the base R implementation below:
iris_sub <- iris[iris$Species %in% c("versicolor", "setosa"),]
rbind(tapply(iris_sub$Petal.Length, iris_sub$Species, mean),
      tapply(iris_sub$Petal.Width, iris_sub$Species, mean))
##      setosa versicolor virginica
## [1,]  1.462      4.260        NA
## [2,]  0.246      1.326        NA
which is much harder to read outloud and can be daunting to parse for students who are new to R.
Why Teach The Tidyverse
David Robinson has been a major proponent of not only teaching the tidyverse, but teaching it first. Whereas the authors of this blog and many more out there probably grew up learning base R first, the above small iris example is likely sufficient to convince a great many why the tidyverse should be taught before base R. The tidyverse is actually EASIER for students to learn than base R because the code flows naturally from the goals of the data anlaysis: subset, group, aggregate. In Robinson’s words, “get students doing powerful things quickly.” Low barriers to entry of data analysis will resonate quite strongly with those teaching or learning statistical computing and data science. The vast majority of exploratory data analysis is accessible via the tidyverse packages.
For example, descriptive statistics are often desired in the following format, which is made vastly simpler by the tidyverse.
iris %>%
  gather(key = "flower_att", value = "measurement", Petal.Length, Petal.Width, Sepal.Length, Sepal.Width) %>%
  group_by(flower_att) %>%
  summarize(Mean = mean(measurement),
            SD = sd(measurement))
## # A tibble: 4 x 3
##   flower_att    Mean    SD
##   <chr>        <dbl> <dbl>
## 1 Petal.Length  3.76 1.77
## 2 Petal.Width   1.20 0.762
## 3 Sepal.Length  5.84 0.828
## 4 Sepal.Width   3.06 0.436
Some of the other most commonly encountered data wrangling challenges involve creating new variables and sorting. Below, two new variables are created then the dataset is sorted (arranged) by them.
iris %>%
  mutate(PetalRatio = Petal.Length/Petal.Width,
         SepalRatio = Sepal.Length/Sepal.Width) %>%
  arrange(desc(PetalRatio), SepalRatio) %>%
  slice(1:5)
##   Sepal.Length Sepal.Width Petal.Length Petal.Width Species PetalRatio
## 1          5.2         4.1          1.5         0.1  setosa         15
## 2          4.9         3.1          1.5         0.1  setosa         15
## 3          4.9         3.6          1.4         0.1  setosa         14
## 4          4.8         3.0          1.4         0.1  setosa         14
## 5          4.3         3.0          1.1         0.1  setosa         11
##   SepalRatio
## 1   1.268293
## 2   1.580645
## 3   1.361111
## 4   1.600000
## 5   1.433333
The tidyverse tools are helpful for aspiring data scientists to jumpstart their work with data in R. Of course there are limitations of the tidyverse, and nobody is suggesting that the tidyverse be the only set of tools taught. The philosophy and consistency of the tidyverse are still fairly young and do not sync nicely with all R packages. Some uses of R for, say, certain types of software development or advanced statistical modeling are not covered by the current collection of tidyverse packages. And so broader knowledge of base R and core computer science techniques are still needed at certain levels.
In any case, knowledge of the tidyverse will make working in R easier and more productive for a great deal of a data scientist’s education.
Learn more
Getting started with the tidyverse: http://www.storybench.org/getting-started-with-tidyverse-in-r/
R for Data Science: https://r4ds.had.co.nz/
David Robinson’s blog posts about the tidyverse: http://varianceexplained.org/r/teach-tidyverse/
R Markdown file for this blog post here
About this blog
Each day during the summer of 2019 we intend to add a new entry to this blog on a given topic of interest to educators teaching data science and statistics courses. Each entry is intended to provide a short overview of why it is interesting and how it can be applied to teaching. We anticipate that these introductory pieces can be digested daily in 20 or 30 minute chunks that will leave you in a position to decide whether to explore more or integrate the material into your own classes. By following along for the summer, we hope that you will develop a clearer sense for the fast moving landscape of data science. Sign up for emails at https://groups.google.com/forum/#!forum/teach-data-science (you must be logged into Google to sign up).
We always welcome comments on entries and suggestions for new ones.